If you want to monitor solar, battery, grid, and household load without ending up with confusing data, the first rule is simple: do not start with the dashboard. Start with the measurement boundaries.
Most confusing home-energy setups are not failing because the app is bad. They are failing because different parts of the system are measuring different things, at different points, in different units, and then presenting those numbers as if they belong in one clean picture.
That is why one dashboard can show strong solar production, another can show battery activity, a third can show imports and exports, and the household still cannot answer the question that actually matters: what is powering the house right now, and what should I change next?
The good news is that you do not need a perfect one-brand ecosystem to get clarity. You do need a clear structure.
The short version
If you want a monitoring setup that stays understandable:
- measure the grid boundary clearly
- measure solar production clearly
- measure battery charge and discharge clearly
- make sure total household load is either directly measured or derived from a trustworthy set of upstream numbers
- avoid counting the same energy twice through overlapping circuits, devices, or app layers
If you already have a solar inverter app and a battery app but still feel blind, that usually means you are missing one of these:
- a trustworthy whole-home meter at the service boundary
- a clean hierarchy between parent and child devices
- a consistent distinction between instantaneous power and accumulated energy
- a single source of truth for each major energy path
Quick architecture table
| What you want to understand | What you must measure clearly | What usually causes confusion |
|---|---|---|
| Grid dependence | Grid import and export at the service boundary | Mixing utility data with inverter-side estimates |
| Solar contribution | Total solar generation | Confusing production with self-consumption |
| Battery behavior | Battery charge, discharge, and sometimes state of charge | Looking only at battery app totals without the house context |
| Whole-home demand | Main load or a trustworthy derived home-consumption number | Adding parent and child circuits together |
| Major sub-loads like EV charging or hot water | Circuit-level or device-level energy data | Treating device data as if it explains the entire house |
Why mixed energy data gets confusing so fast
The biggest problem is that different devices sit at different points in the electrical story.
An inverter app usually knows solar production well. A battery platform usually knows battery charge and discharge well. A utility meter or main energy meter usually knows grid import and export best. A circuit monitor may know one branch load very well. But none of those numbers automatically explain the whole house on their own.
That means you can easily end up with all of these at once:
- solar production from the inverter
- battery flow from the storage system
- grid import and export from the meter
- charger or hot-water usage from a branch monitor
- total house consumption estimated somewhere else
Each number may be individually correct. The confusion starts when they are mixed without checking whether they describe the same boundary.
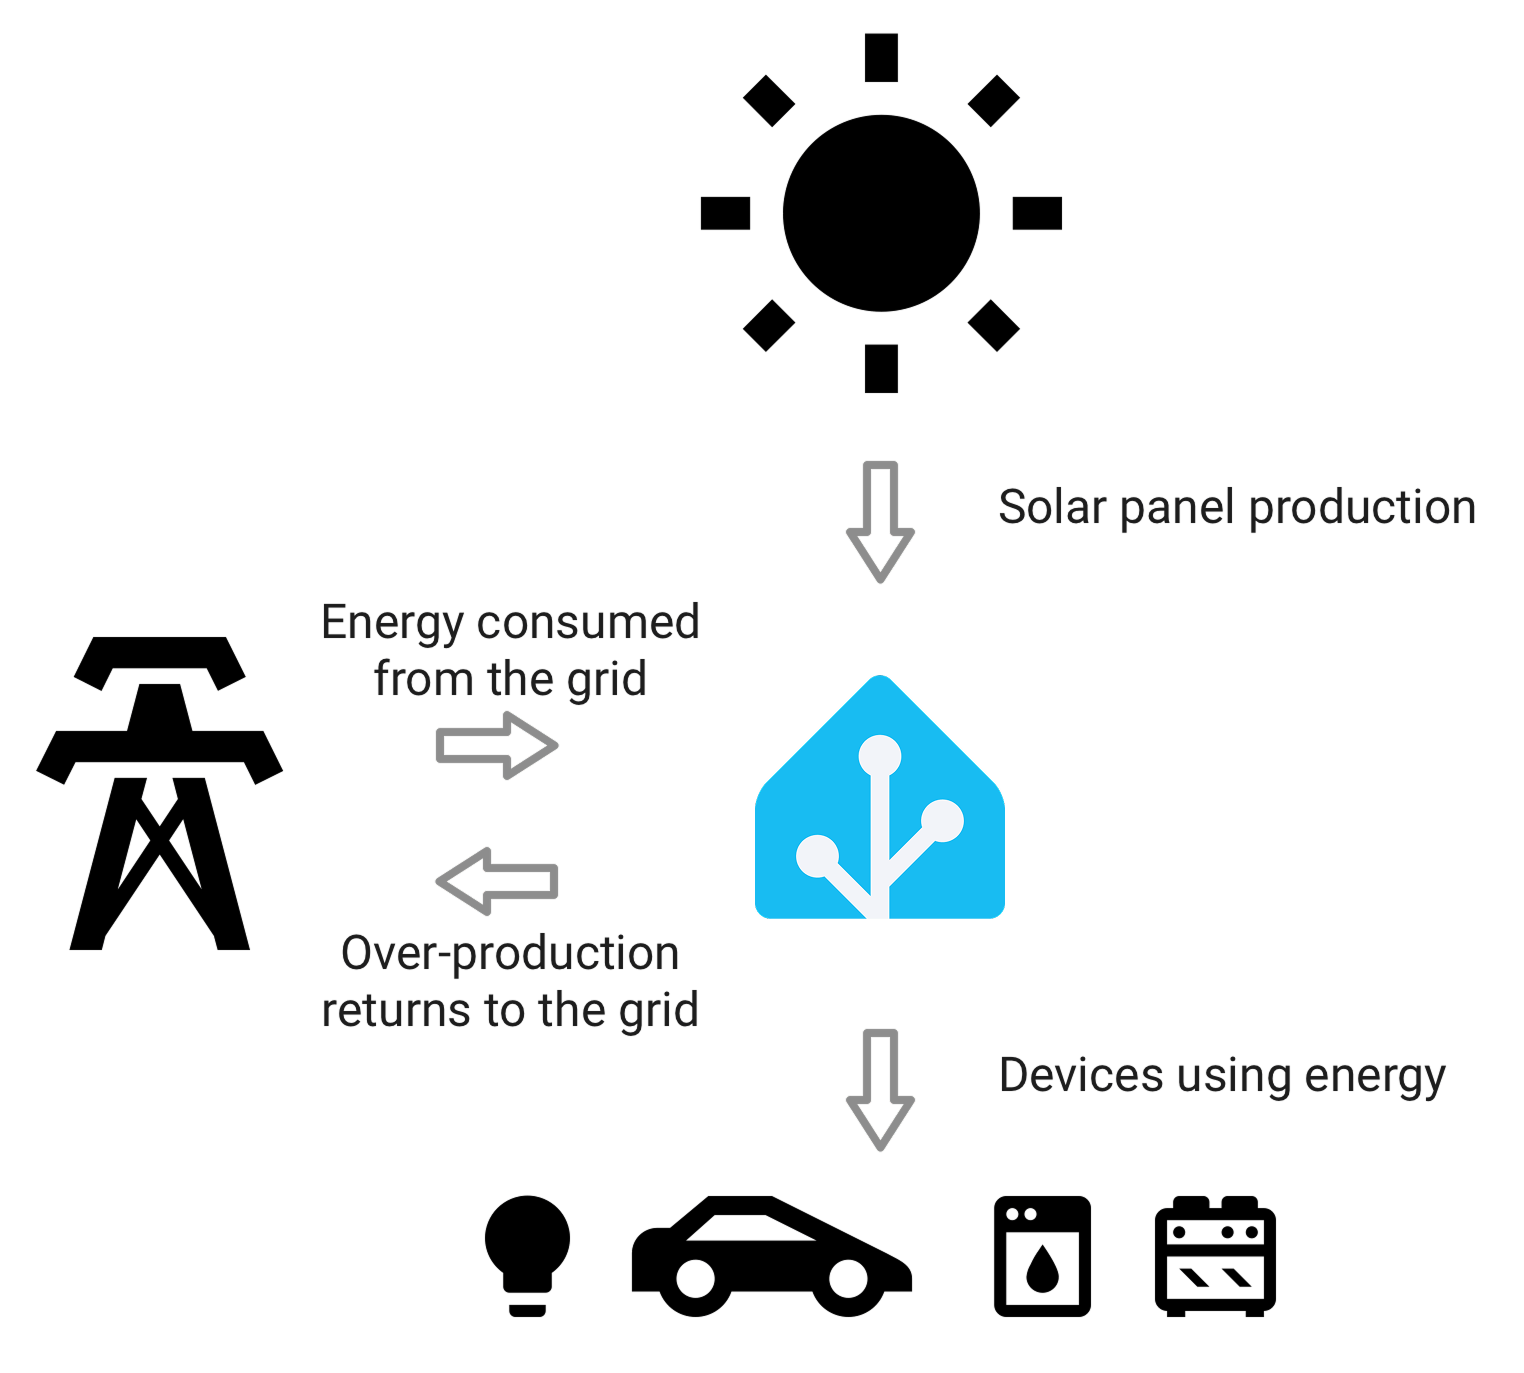
Home Assistant's energy documentation makes this distinction explicit by separating grid, solar, batteries, and individual devices into different energy sources and relationships instead of treating everything as one flat number set.
The four layers that matter most
1. Grid boundary
This is the first anchor.
If you do not know what is crossing the grid boundary, it becomes hard to judge whether the home is truly self-consuming solar well, whether the battery is reducing imports meaningfully, or whether a new load is creating an expensive evening spike.
For most mixed solar-and-battery homes, the service boundary tells you what the home still needs from the grid and what it is sending back.
2. Solar production
This is the second anchor.
You need one trustworthy view of how much solar energy the system is producing. That usually comes most naturally from the inverter side, not from a guessed household balance.
But production alone does not tell you whether the house is using that solar well. It only tells you what was generated.
3. Battery flow
Battery visibility needs more than state of charge.
A battery app may show that the battery is at 68%, but the more useful operating question is often this:
- is the battery charging from excess solar or from the grid?
- is it discharging into the house at the right times?
- is it genuinely reducing imports or just moving energy around in a way that looks impressive in the app?
That is why battery data needs to be interpreted alongside grid and whole-home load, not alone.
4. Household load
This is the layer that many homes are missing.
If you cannot see total household demand clearly, it becomes much harder to answer questions like:
- why are we still importing so much after sunset?
- is the battery too small, or is the evening load simply larger than expected?
- is the EV charger overwhelming the house when other loads are already running?
- are we solving a battery problem when the real issue is a large unmanaged load?
This is exactly why articles like How to Add Consumption Monitoring to a Solar Home That Only Has Inverter Data and Main Meter vs Circuit Meter for Solar Homes: Which One Do You Actually Need? remain important even after a home adds more advanced solar hardware.
What most homes should monitor first
Starter path: inverter app plus battery app
This can be enough when the household mainly wants:
- basic solar visibility
- basic battery activity
- rough confidence that the system is operating
But it is often not enough when the household wants to understand the whole energy picture. It usually leaves a gap around total house load and clean grid-boundary interpretation.
Better path: add a trustworthy main meter
This is often the best upgrade.
Once you add a reliable main meter or whole-home monitor, the system becomes easier to interpret because you can place the rest of the data around a stable upstream boundary.
If you already have solar and battery apps, a whole-home meter often adds more clarity than another software layer does.
Advanced path: unify the data with a clean hierarchy
A broader platform such as Home Assistant, IAMMETER Cloud, or IAMMETER Local can be very useful when the household wants one place to compare solar, battery, grid, and device-level loads.
But the platform only helps if the data model is clean.
Home Assistant's individual-device guidance explicitly supports upstream-device relationships so parent circuits and child devices do not get counted twice. That principle matters well beyond Home Assistant itself: if one system measures the breaker and another measures the load beneath it, you need to decide which one is the parent and which one is the child.
The most common ways people accidentally create bad dashboards
Adding parent and child energy together
This is the classic mistake.
If you monitor a main circuit and then also monitor individual devices beneath it, you cannot just add those numbers as if they are separate consumption streams. That creates inflated totals and dashboards that look detailed but are structurally wrong.
Mixing power and energy without noticing
Power is an instantaneous rate. Energy is accumulated over time.
If one source reports watts or kilowatts and another reports kilowatt-hours, they are not interchangeable. Home Assistant's energy guidance explicitly notes that power sensors often need to be converted into energy sensors before they behave properly inside the energy model.
Mixing app estimates with meter truth
An inverter may estimate household behavior from internal assumptions. A battery platform may estimate self-consumption in its own way. A utility or main energy meter may show a different result because it sits at the real grid boundary.
This does not automatically mean one source is broken. It often means the sources are describing different parts of the system.
Letting multiple systems claim the same boundary
You want one primary source for each major layer:
- one main grid-boundary source
- one main solar-generation source
- one main battery-flow source
- one main whole-home load source
After that, add circuit or device detail carefully.
A practical way to build a clean monitoring stack
Use this order.
1. Anchor the grid boundary first
If the home already has solar and possibly a battery, start by making sure import and export are clear.
2. Keep solar generation as its own source
Do not try to back-calculate everything from the load side if the inverter already provides a clean generation signal.
3. Decide whether household load is measured or derived
Either approach can work. The important thing is to know which one you are relying on, and whether it stays trustworthy when battery charging, export, or branch loads change.
4. Add battery flow in context
Battery charge and discharge only become decision-useful when you can compare them against total load and grid behavior.
5. Add device or circuit detail last
Once the upstream picture is correct, add EV charging, hot water, HVAC, or other large loads as child layers rather than as separate competing truths.
If you are still planning the architecture, Solar Monitoring Planner is a better starting point than jumping straight into app comparisons. If the real next decision is battery fit rather than dashboard fit, Battery Size Estimator is a more useful follow-on tool.
Which setups benefit most from hierarchy
Hierarchy matters most when the home has:
- a main meter plus one or more branch meters
- solar plus battery plus EV charging
- a panel monitor plus smart plugs or device-level reporting
- multiple dashboards or software layers pulling from different device types
In these homes, hierarchy is what prevents the data from becoming a crowded wall of partially overlapping truths.
This is also why some homes still feel blind even after buying extra monitoring hardware. The problem is not always missing hardware. Sometimes it is missing structure.
Common mistakes to avoid
Expecting the battery app to explain the house
It explains the battery well. It does not automatically explain the whole home.
Expecting solar production to explain savings
Production matters, but the savings story also depends on timing, exports, battery cycling, and household demand.
Treating every available sensor as equally useful
More sensors do not guarantee more clarity. The useful sensors are the ones that answer a specific boundary question.
Building the dashboard before deciding the measurement logic
This usually creates a beautiful view of a confusing system.
Recommended starting points
If the home has solar and a battery but the owner still cannot tell what is happening:
- first fix the grid boundary
- then confirm whole-home load visibility
- then map battery flow against that upstream picture
- only then add circuit-level or device-level detail
If the home is mixed-brand and wants one combined view, unify the data only after deciding the parent-child relationships and source-of-truth boundaries.
If the home mostly wants to understand whether the battery is the right next upgrade, read How to Decide Whether a Hybrid Inverter Is Worth the Extra Complexity, Will a Home Battery Save You Money With Solar?, and the Enphase IQ Battery 5P device page next.
Bottom line
The best way to monitor solar, battery, grid, and household load without ending up with confusing data is to treat the system as a set of measurement layers, not a collection of apps.
Get the grid boundary right. Keep solar production clear. Put battery flow in context. Make sure household load has a trustworthy place in the model. Then add device-level detail without double-counting the parent layers.
A clean energy dashboard is not created by adding more tiles. It is created by giving each number a clear job.
Related reading
- How to Add Consumption Monitoring to a Solar Home That Only Has Inverter Data
- Main Meter vs Circuit Meter for Solar Homes: Which One Do You Actually Need?
- How to Decide Whether a Hybrid Inverter Is Worth the Extra Complexity
- What an Open Energy Meter Lets You Do That a Closed App Usually Does Not
- Solar Monitoring Planner
- Battery Size Estimator
- Home Assistant
- IAMMETER Cloud
- IAMMETER Local