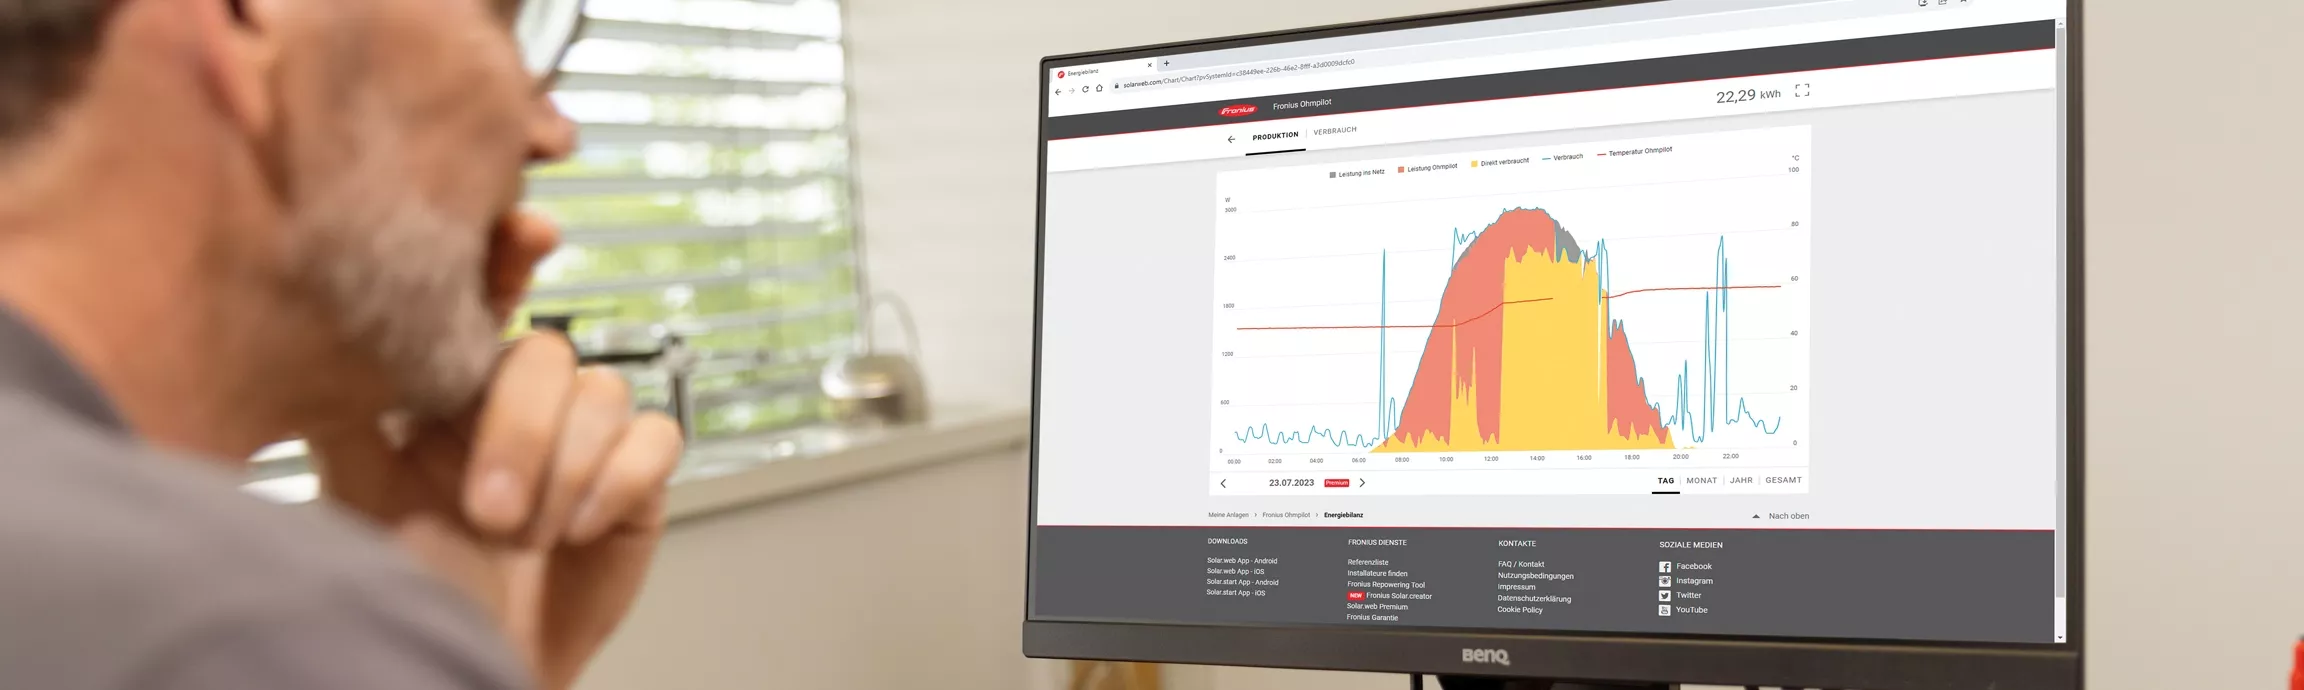
If your solar home already has an inverter app, maybe a battery app, and one or two extra monitoring devices, it can be frustrating to realize that you still cannot answer the questions that actually matter.
You can see graphs. You can see production. You may even see battery charge and discharge. But you still cannot tell why imports spike in the evening, whether the battery is really reducing grid dependence, or which load is quietly ruining self-consumption.
That usually happens for one simple reason: extra monitoring is not the same thing as complete visibility. Many homes add more data sources without fixing the missing measurement boundary, the missing source of truth, or the missing relationship between whole-home and device-level data.
The short version
If a solar home still feels blind after installing extra monitoring, the problem is usually one of these:
- You can see solar production, but not total household demand.
- Different apps are describing different parts of the system, not one shared truth.
- Grid import and export are missing or only estimated.
- Device-level monitors were added before the main system boundary was made clear.
- Parent and child loads are being mixed in a way that inflates or confuses totals.
- The dashboards look detailed, but they still do not point clearly to the next action.
In most homes, the best fix is not “more sensors everywhere.” It is to clarify the main boundary first, then add the next layer only where it answers a real question.
Quick symptom table
| What the owner feels | What is usually missing | What usually helps most |
|---|---|---|
| “Solar looks good, but I still do not know why bills are high.” | Clean whole-home import and export context | A trustworthy main meter at the grid boundary |
| “The battery app looks active, but I cannot tell if it is helping.” | Battery data compared against household load and grid flow | Better whole-home visibility before more battery dashboards |
| “My apps disagree with each other.” | Shared measurement boundary and source-of-truth logic | Decide which system owns grid, solar, battery, and load numbers |
| “I added smart plugs or branch monitors but the totals now look strange.” | Parent-child hierarchy | Keep device detail underneath a clear upstream meter |
| “I know one big load matters, but I still cannot prove it.” | Targeted circuit-level visibility | Add one branch monitor only after the mains picture is clear |
1. The inverter app is not the same thing as whole-home visibility
This is the most common blind spot.
A solar inverter usually does a good job showing production. Some ecosystems can also show more of the energy picture when the right smart meter or CT hardware is installed. But production data alone does not explain the house.
SolarEdge’s own support documentation is explicit on this point: monitoring a site’s energy consumption requires a SolarEdge Energy Meter, and without that meter the dashboard only shows production. Enphase makes the same distinction in its support material, where consumption monitoring is described as an optional feature that requires dedicated metering hardware and CTs.
That matters because many households think they already have “monitoring” when what they really have is generation visibility.
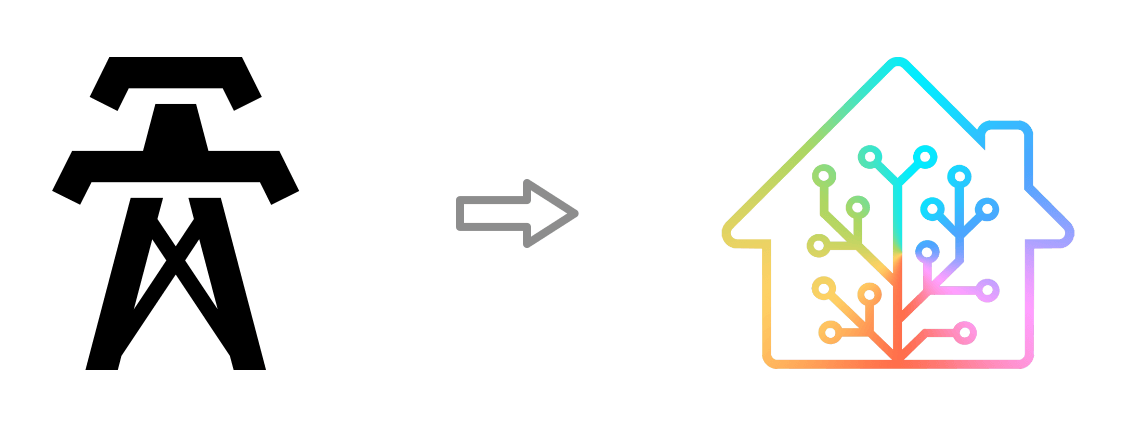
If the grid boundary is not measured clearly, the house can still feel blind even when solar production looks detailed.
If the real question is any of the following, production alone will not be enough:
- Why do imports rise sharply after sunset?
- Is the battery too small, or is evening demand simply too high?
- Are we exporting too much during the day because flexible loads are not shifting?
- Is the EV charger or hot water system overwhelming the rest of the house?
For those questions, a clear grid-boundary and whole-home demand view usually matters more than one more solar graph.
2. More apps often means more fragments, not more clarity
A lot of mixed solar homes end up with this stack:
- inverter app for solar production
- battery app for charge and discharge
- charger app for EV sessions
- vendor dashboard for a smart meter or panel monitor
- maybe Home Assistant or another dashboard on top
Each of those layers can be useful. The problem is that they do not automatically describe the same point in the electrical story.
One app may sit at the inverter. Another may sit at the battery gateway. Another may sit at the service mains. Another may sit on one circuit only. If you compare them as if they are interchangeable, the home still feels blind even though it seems full of data.
Home Assistant’s energy documentation describes this well: the dashboard becomes more complete as you add grid, solar, battery, and device sources, but those sources need to be understood as separate roles inside one model.
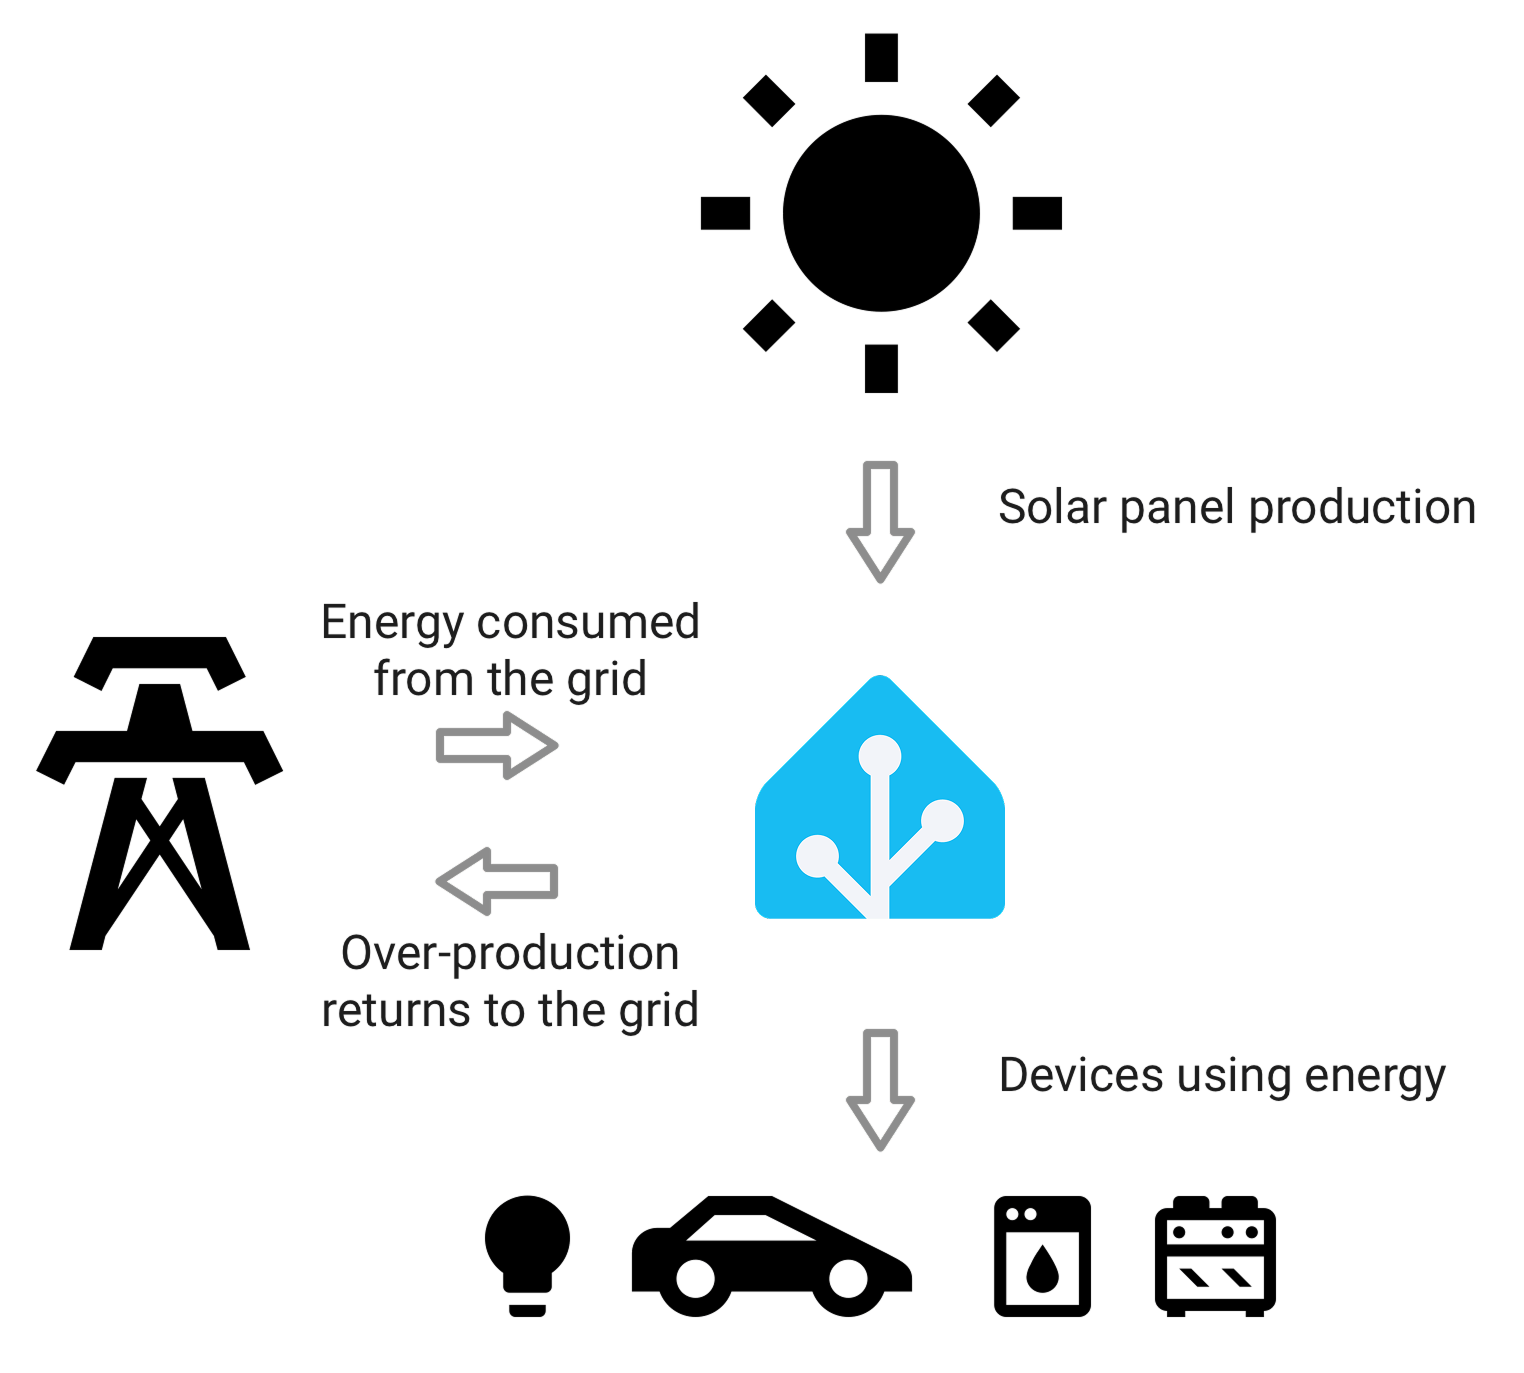
Visibility improves when each data source has a clear job, not when every app is treated as a full-system truth.
That is why two dashboards can both be correct and still leave the owner confused. They are not necessarily contradicting each other. They may simply be measuring different boundaries.
3. The system may be missing a true source of truth at the mains
Home Assistant’s grid documentation says the best way to get grid data is directly from the electricity meter that sits between the house and the grid. That principle extends beyond Home Assistant.
If the mains boundary is fuzzy, every downstream interpretation becomes harder:
- self-consumption calculations become less trustworthy
- battery benefit is harder to judge
- tariff timing analysis becomes weaker
- device-level monitors float without enough context
This is why some homes add several small monitoring layers and still feel blind. They improved detail before securing the main reference point.
For many solar homes, the cleanest order is:
- Make the grid boundary trustworthy.
- Confirm solar production is trustworthy.
- Decide whether total household load is directly measured or carefully derived.
- Add battery interpretation in that context.
- Add branch or device detail only where it changes a decision.
That order often produces better clarity than buying the “smartest” dashboard first.
4. Extra device detail can make the totals worse if hierarchy is unclear
Another common reason solar homes still feel blind is that they add branch detail without deciding how it relates to the main meter.
Home Assistant’s individual-device documentation now supports upstream-device relationships specifically to prevent double counting. The reason is simple: if one device measures a whole circuit and another measures an appliance on that same circuit, you cannot add both as if they are independent loads.
Without that hierarchy, the dashboard can become more detailed and less trustworthy at the same time.
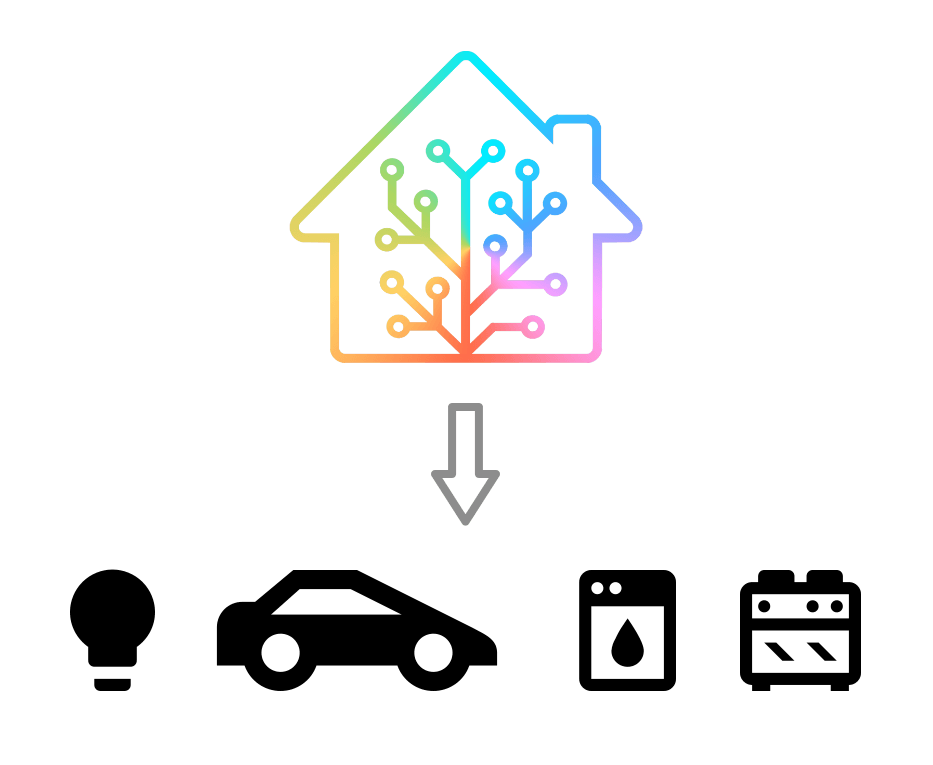
Device-level monitoring only helps when the system understands what is upstream and what is downstream.
This problem shows up in real homes when people add:
- smart plugs under a panel monitor
- EV charger telemetry under a whole-home meter
- hot-water or heat-pump sensors under a monitored main circuit
- branch CTs without clear parent-child logic
The result is often not a lack of data. It is a lack of structure.
5. One big hidden load can keep the whole system feeling vague
Sometimes the household is not missing more whole-home monitoring. It is missing one targeted answer.
A home may already know:
- how much solar it produces
- how much it imports and exports
- how active the battery is
But it may still not know whether one heavy load is the real reason the system feels disappointing. This is common with:
- EV chargers
- electric hot water
- heat pumps or ducted HVAC
- pool equipment
- workshop circuits
In that case, the next step is not another broad dashboard. It is one targeted measurement point that explains the suspicious load.
The mistake is adding targeted detail too early, before the mains picture is clean. The better sequence is usually whole-home first, then one important branch.
6. The problem is often actionability, not data volume
A monitoring setup feels useful when it helps the owner decide what to do next.
A setup still feels blind when it leaves questions like these unresolved:
- Should we shift more daytime loads into solar hours?
- Is the battery undersized, misused, or simply solving the wrong problem?
- Is export high because the house is efficient, or because flexible loads are unmanaged?
- Do we need another meter, or do we just need to read the existing layers correctly?
This is where some app-first setups disappoint. They show activity, but not decision boundaries.
Fronius positions its Smart Meter and Solar.web pairing around energy consumption visibility and optimization, and SolarEdge positions metering as the step that unlocks production plus consumption insight. Those vendor messages matter because they point to the same operational truth: you do not get action-ready visibility just by having solar telemetry. You get it by measuring the right additional layer.
7. What to fix before buying more hardware
If a solar home still feels blind, use this order before buying the next device.
First, ask what question is still unanswered
Do not start with the product. Start with the blind spot.
Examples:
- “We cannot explain imports after sunset.”
- “We cannot tell whether the battery is really helping.”
- “We know the problem is one large load, but we cannot prove which one.”
- “We have lots of graphs, but no shared picture.”
Second, check whether the mains boundary is trustworthy
If grid import and export are unclear, fix that first.
Third, decide whether the problem is boundary, hierarchy, or missing load detail
Those are three different problems, and they need different fixes.
Fourth, add only the next layer that resolves the real blind spot
That may be:
- a main smart meter
- a better whole-home monitor
- one circuit monitor
- a cleaner local or hybrid dashboard
- better parent-child structure in the software layer
A practical correction path for most solar homes
For most mixed-brand or evolving solar homes, the most reliable correction path looks like this:
- Keep the inverter data for production.
- Add or verify a trustworthy grid-boundary meter.
- Make sure battery behavior is interpreted against house load and grid flow.
- Use one dashboard or system as the organizer, not five competing truths.
- Add device-level detail only for the loads that are actually changing decisions.
That usually produces much better results than collecting more and more isolated views.
Bottom line
Some solar homes still feel blind after installing extra monitoring because the missing piece was never “more data” in the abstract. The missing piece was usually one of these: a clear mains boundary, a trustworthy whole-home load picture, a clean hierarchy, or a dashboard model that separates solar, grid, battery, and device roles properly.
The fix is rarely to monitor everything at once. The fix is to identify the exact blind spot, anchor the main boundary, and then add the next layer that answers a real operational question.
When that structure is right, the system stops feeling like a pile of apps and starts feeling like usable visibility.
Related reading
- What to Check Before Adding an Energy Meter to an Existing Solar System
- How to Monitor Solar, Battery, Grid, and Household Load Without Ending Up With Confusing Data
- What Should You Upgrade First If You Want Better Energy Visibility, Not Just Lower Bills?
- Cloud Monitoring vs Local Monitoring for Solar Homes: What Changes in Real Life?
- How to Avoid the Most Common CT Clamp Mistakes in Home Energy Monitoring
- Shelly Pro 3EM
- Emporia Vue 3
- GoodWe Smart Meter GMK110
- Home Assistant
Sources
- Home Assistant: Home energy management
- Home Assistant: Integrating your electricity grid
- Home Assistant: Integrating individual device energy usage
- SolarEdge: Track Energy Production and Consumption
- SolarEdge: Energy Meter with Modbus Connection
- Fronius Smart Meter
- Fronius Smart Meter WR technical page
- Enphase: What is consumption monitoring?