If your solar app says the panels are producing but your energy monitor shows zero export, do not assume the monitor is broken. Zero export can be completely normal when the home is using all available solar, charging a battery, obeying an export limit, or reporting data from a different measurement point than the inverter app.
The key is to separate three numbers that often get mixed together:
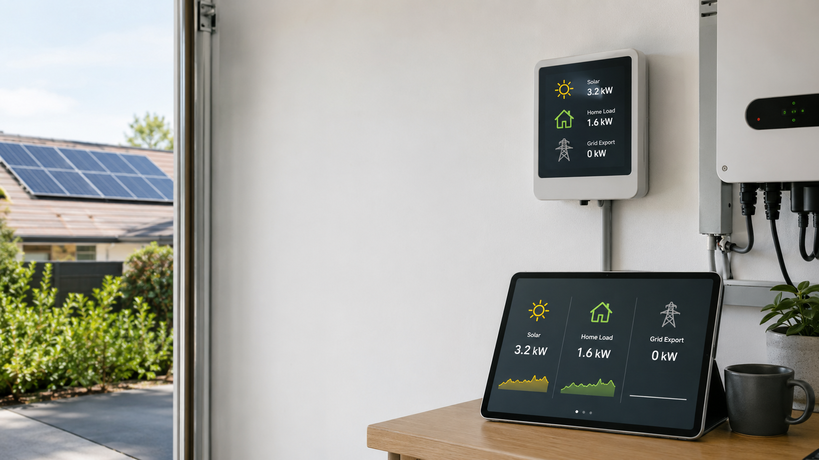
- Solar production: what the inverter or PV system is generating.
- Household load: what the home is consuming at that moment.
- Grid export: what is left over after the home, battery, and control settings have taken their share.
A home can be producing 5 kW of solar and still export 0 kW if the house is using 3 kW and the battery or EV charger is absorbing the rest. The same display can also happen because of CT clamp direction, phase mapping, a zero-export inverter setting, or a dashboard configuration issue.
The quick answer
Start with the simplest explanation: compare current solar production with current household load.
| What you see | Most likely meaning | First check |
|---|---|---|
| Solar production is close to home load | Solar is being self-consumed | Turn off or delay one large load and watch whether export appears |
| Solar is high, home load is low, battery is charging | Surplus is going into the battery | Check battery charge power and state of charge |
| Solar is high, load is low, battery is full, export is still zero | Export may be limited or misread | Check inverter export-limit settings and grid meter data |
| Utility meter shows export but app shows zero | Monitoring setup may be wrong | Check CT direction, phase assignment, and dashboard entity mapping |
| One phase exports while another imports | Three-phase netting may be hiding the detail | Compare per-phase and total import/export views |
For a broader monitoring-path check, the Solar Monitoring Planner can help you decide whether your current setup is missing inverter data, whole-home metering, local data access, or a better dashboard layer.
Reason 1: the house is using the solar before it reaches the grid
Grid export is not the same thing as solar production. Export is only the unused surplus after household consumption has already been served.
For example:
| Solar production | Home load | Battery or EV charging | Grid export |
|---|---|---|---|
| 4.8 kW | 4.6 kW | 0.0 kW | 0.2 kW |
| 4.8 kW | 4.8 kW | 0.0 kW | 0.0 kW |
| 4.8 kW | 2.2 kW | 2.6 kW | 0.0 kW |
| 4.8 kW | 1.5 kW | 0.0 kW | 3.3 kW |
This is why a zero-export reading is often good news: your solar is being used locally instead of being sold back at a low feed-in rate. The problem only starts when zero export does not match the physical situation.
A quick test is to look for large flexible loads. Hot water, EV charging, pool pumps, underfloor heating, air conditioning, and battery charging can absorb a surprising amount of daytime solar. If one of these loads is running, zero export may be exactly what the system is trying to achieve.
Reason 2: the inverter is running in zero-export or export-limited mode
Many solar inverters can be configured to limit export. This may be required by the utility, set by the installer, or enabled because the system was designed for self-consumption rather than feed-in revenue.
Export limiting usually works by measuring grid flow at the main connection point. If the inverter sees power about to flow to the grid, it reduces PV output, charges a battery, diverts energy to a load, or holds output near the allowed export value.
Check these settings before assuming the meter is wrong:
- Export limit: set to 0 W, a small fixed value, or a regional grid limit.
- Meter communication: inverter cannot see the export meter or CT correctly.
- Fail-safe behavior: inverter falls back to zero export when the meter signal is lost.
- Installer mode settings: a limit may be hidden in advanced configuration.
- Grid approval: the installed system may be approved for partial or no export.
If the inverter app shows solar generation lower than expected at midday while the panels have good sun, export limiting may be actively curtailing PV output. That is different from a monitor simply failing to display export.
Reason 3: the battery is absorbing the surplus
A battery can make grid export look like zero for long periods, especially on sunny mornings. Solar may be producing normally, but the battery management system is prioritizing charge before export.
Look for these clues:
- Battery charge power rises when solar output rises.
- Grid export stays near zero until the battery reaches a high state of charge.
- Export appears later in the day after the battery is full or charge power tapers.
- The inverter app reports self-consumption or battery charging instead of export.
This is one reason battery, solar, grid, and load should be monitored as separate flows. If the dashboard only shows solar and grid, it may look as if energy has disappeared. The article on monitoring a home battery, solar, and grid in one place goes deeper into avoiding that confusion.
Reason 4: the CT clamp is in the wrong place or direction
If a clamp-style monitor is responsible for the grid import/export reading, placement matters. A CT clamp must measure the correct conductor at the correct boundary, and its direction must match the software's sign convention.
Common mistakes include:
- The CT is placed on a solar subcircuit instead of the main grid feed.
- The CT is clamped around both active and neutral conductors, canceling the reading.
- The arrow direction is reversed, so export may appear as import or negative power.
- The CT is on the wrong phase in a multi-phase home.
- The monitor is measuring only part of the switchboard, not the whole home.
A good diagnostic pattern is to create a known condition. Turn on a large load with solar low or off, then confirm the monitor shows import. Later, when solar is high and loads are low, confirm whether the sign reverses or export appears. If the value changes in the wrong direction, the issue is likely CT direction, CT assignment, or dashboard sign handling.
For a focused checklist, see CT clamp placement mistakes that break solar monitoring and why an energy monitor shows negative power.
Reason 5: your dashboard is showing net power, not export energy
Some dashboards show instantaneous net grid power. Others show separate import and export energy totals. Those are not interchangeable.
A live power tile can sit at 0 kW because import and export are balanced at that moment. An energy total may stay flat because no export has accumulated over the selected period. A tariff or billing screen may use utility-meter intervals rather than live inverter data.
Check the unit and data type:
| Dashboard label | Usually means | How to interpret it |
|---|---|---|
| Grid power, W or kW | Live import/export flow | Can change every few seconds |
| Export energy, kWh | Accumulated exported energy | Increases only when surplus actually flows out |
| Feed-in credit | Billing or tariff value | May update slowly or after utility data arrives |
| Net consumption | Import minus export | Can hide separate import and export events |
| Self-consumption | Solar used on site | Higher self-consumption can mean lower export |
If you are setting up Home Assistant or another local dashboard, make sure import and export are separate long-term energy sensors where required. A power sensor alone is not always enough for correct energy statistics.
Reason 6: three-phase homes can be importing and exporting at the same time
Three-phase solar adds another layer. One phase can export while another imports, and different systems may show different totals depending on whether they display per-phase flow or netted whole-home flow.
For example:
| Phase | Flow |
|---|---|
| Phase A | Export 1.2 kW |
| Phase B | Import 0.7 kW |
| Phase C | Import 0.5 kW |
| Netted total | 0.0 kW |
A dashboard that only shows the net total may display zero export even though one phase is exporting. Another dashboard may show per-phase export and import separately. Neither is necessarily wrong; they are answering different questions.
If this is your situation, compare:
- per-phase grid power,
- total net grid power,
- accumulated import energy,
- accumulated export energy,
- the utility billing method for your region.
The practical guide to reading three-phase home energy data explains why this can look contradictory at first.
A safe troubleshooting sequence
Use this order before changing hardware or installer settings.
- Check whether zero export is actually expected. Compare solar production, home load, battery charging, and EV charging.
- Wait for a clean test window. Choose sunny midday, low household load, battery full or paused, and no major flexible loads.
- Compare inverter app and grid meter. If both show zero export, export limiting or self-consumption is more likely.
- Check the utility meter if accessible. Look for live import/export indicators or interval data, but remember utility data may update slowly.
- Test CT direction with a known load. Confirm the grid reading increases on import and reverses or drops correctly during surplus solar.
- Check phase mapping. In three-phase homes, confirm each voltage and current channel belongs to the same phase.
- Review dashboard entities. Make sure export energy, import energy, and live grid power are not being mixed.
- Ask the installer about export-limit settings. Do this before changing protected inverter configuration.
When zero export is normal
Zero export is usually normal when:
- the home is consuming most of the solar in real time,
- a battery is charging,
- an EV charger is following surplus solar,
- hot water or another controlled load is running,
- the system is intentionally configured for zero export,
- the selected dashboard tile shows net flow instead of separate export.
In those cases, the question is not “why is export zero?” The better question is whether the solar is going somewhere useful. If it is covering household load or charging storage, the system may be doing exactly what you want.
When zero export deserves investigation
Investigate further when:
- solar production is high,
- household load is clearly low,
- the battery is full or not charging,
- no EV or controllable load is running,
- the utility meter shows export but the monitoring app does not,
- export never appears across multiple sunny days,
- the inverter reports meter communication errors,
- the dashboard recently changed after a CT, firmware, or integration update.
That combination points toward export limiting, measurement placement, CT direction, phase mapping, or dashboard configuration rather than normal self-consumption.
What to record before asking for help
Before contacting an installer, platform support team, or electrician, capture a small evidence pack:
- date and time of the test,
- solar production in kW,
- home load in kW,
- grid import/export reading,
- battery charge/discharge power,
- inverter export-limit setting if visible,
- photos of CT clamp placement if safe and permitted,
- screenshots of the dashboard tiles involved,
- whether the home is single-phase, split-phase, or three-phase.
This prevents the support conversation from turning into guesswork. It also helps separate a real system-control issue from a dashboard-label issue.
Bottom line
Zero export while solar is producing is not automatically a fault. It often means the home is using its own solar, charging a battery, or obeying an export limit. But if the physical situation should create surplus and the monitor still shows zero, the most likely causes are CT placement, CT direction, phase mapping, inverter meter communication, or dashboard configuration.
The best fix is not to chase the app reading in isolation. Confirm where the solar is going, verify the measurement boundary, and then decide whether the issue is energy flow, hardware setup, or software interpretation.