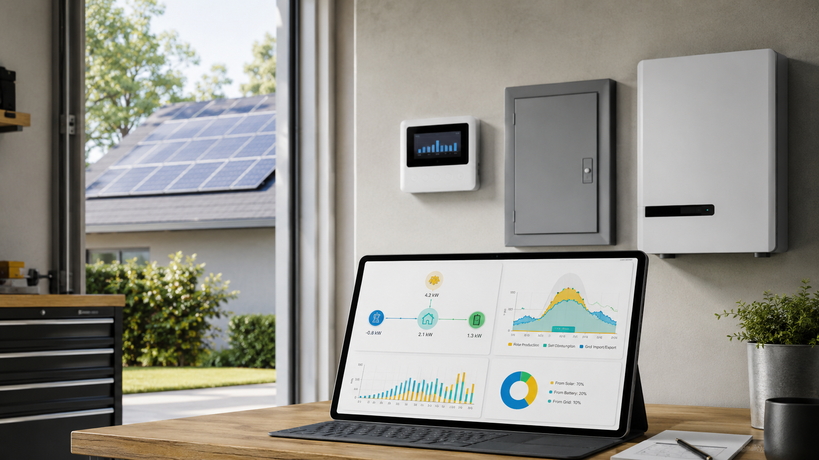
Most solar inverter apps are good at answering one question: how much energy did the solar system produce? A good solar home monitoring setup answers the more useful follow-up questions: how much of that energy was used in the house, how much went to the grid, when the home still imported power, and which future upgrade would actually improve the result.
That difference matters. A home can have a healthy solar production curve and still have a disappointing bill if daytime loads are low, evening demand is high, export rates are weak, or the monitoring setup cannot separate solar generation from household consumption. The inverter app is a starting point, not the whole measurement system.
This guide explains what a complete, practical solar monitoring setup should include before you add another meter, battery, EV charger, diverter, or dashboard.
The Short Version
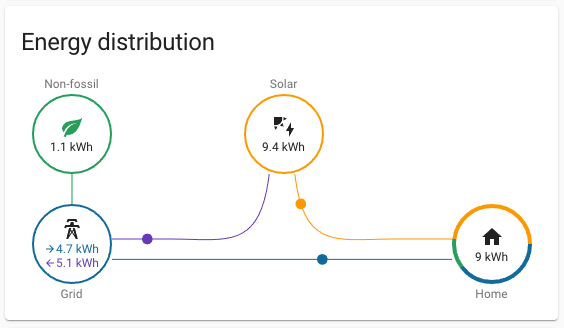
A good solar home monitoring setup should show at least five things clearly:
- solar production
- grid import
- grid export
- household consumption
- solar self-consumption
For homes with batteries, EV chargers, heat pumps, or electric hot water, it should also show whether those flexible loads are using solar, grid power, battery power, or a mixture.
The best setup is not always the most complex one. For many homes, the right answer is one reliable meter at the grid connection, one reliable view of inverter production, and a dashboard that calculates import, export, self-use, and net load consistently. More circuit meters can help, but only if the main energy flow is already correct.
Why the Inverter App Is Not Enough
An inverter app is usually strongest at production monitoring. It can show daily yield, current PV power, inverter status, alerts, and sometimes string or module-level details depending on the system architecture.
That is valuable, but it does not always explain the bill. The missing side is consumption.
If the app only knows what the inverter produced, it may not know whether the home used that energy immediately, exported it, imported at the same time on another phase, or charged a battery. Even when the inverter platform supports consumption monitoring, it may require an extra meter, current transformers, or a supported smart meter accessory.
This is why many owners say, "My system generated plenty of energy, so why is the bill still high?" The answer is usually hidden in the boundary between solar generation, household load, and the grid.
Start With the Measurement Boundary
Before choosing hardware, define what you want to measure. In solar monitoring, the most important boundary is usually the grid connection.
A grid-side meter tells you whether the site is importing from the utility or exporting surplus solar. Without this point, self-consumption is often guessed rather than measured.
The second useful boundary is the inverter output. This confirms actual solar generation independently from the grid meter. If you know both generation and grid exchange, you can derive household consumption more reliably.
A simple model looks like this:
| Measurement | Why it matters |
|---|---|
| Solar production | Confirms the PV system is generating as expected |
| Grid import | Shows when the home still buys electricity |
| Grid export | Shows surplus solar that was not used on site |
| Household load | Reveals total demand behind the meter |
| Direct self-consumption | Shows how much solar actually reduced purchased electricity |
| Battery charge and discharge | Explains whether storage is helping or hiding grid use |
| Flexible loads | Shows whether EV charging, hot water, or heat pumps are using cheap or solar energy |
If these boundaries are wrong, the dashboard can look polished while the conclusions are wrong.
The Data a Good Dashboard Should Make Obvious
A useful solar monitoring dashboard should not force the reader to reverse-engineer the home from raw charts. It should make a few daily questions easy.
First, did solar production look normal for the season and weather? A single low day may be clouds. A repeated pattern may point to shading, clipping, inverter limits, grid export limits, or a system fault.
Second, when did the home import electricity? Import during the evening is normal. Import during strong midday solar may indicate a large load, battery behavior, a phase imbalance, an export-control rule, or incorrect metering.
Third, when did the home export electricity? Export is not automatically bad, but it is usually worth comparing against the feed-in tariff, import tariff, and flexible loads. If export value is low, the owner may get more value from shifting hot water, EV charging, pool pumps, or appliance use into solar hours.
Fourth, what is the self-consumption pattern? A household that uses 70% of its solar directly has a different upgrade path from a household that exports most of its generation and buys back electricity at night.
Home Assistant's energy documentation describes this broader view well: the energy dashboard can combine grid, solar, battery, gas, water, and individual device sources, and additional sources make the picture more complete. That is the practical point: the value is not one more chart; it is seeing the flow in context.
Consumption Monitoring Should Be Treated as Core, Not Optional
For many solar homes, consumption monitoring is the missing piece. Enphase describes consumption monitoring as the feature that measures home energy usage when used with the appropriate metered gateway and current transformers. Fronius positions its Smart Meter as a bidirectional meter for recording consumption as well as power drawn from or fed into the grid.
The exact hardware differs by ecosystem, but the principle is the same: production alone is not enough.
If the inverter ecosystem offers a supported meter, it is often the cleanest option for export limiting, battery control, and vendor support. If the goal is independent visibility, a separate energy meter can also work well, especially when it integrates with Home Assistant, MQTT, Modbus, a local API, or a third-party dashboard.
The key is to avoid buying only for the app. Buy for the measurement point, the data access path, and the decisions the data must support.
Do Not Add Circuit-Level Monitoring Too Early
Circuit-level monitoring can be useful, but it should come after the main solar, grid, and load picture is trustworthy.
Separate circuit metering makes sense when you need to track a large flexible load such as:
- an EV charger
- a heat pump
- electric hot water
- a pool pump
- a workshop or studio
- a tenant area
- a critical load panel
It is less useful when it becomes a substitute for fixing the main energy balance. If whole-home import, export, and production are wrong, adding more circuit data usually creates more confusion.
A practical order is:
- Verify solar production.
- Measure grid import and export.
- Confirm household load makes sense.
- Add battery and EV data if present.
- Add circuit-level meters only for loads that change decisions.
That last phrase matters. A separate circuit meter is worth it when it changes an action: when to charge the car, whether the heat pump is oversized, whether hot water should move to midday, or whether a battery is covering the right loads.
Battery and EV Data Need Special Care
Batteries and EV chargers can make energy dashboards harder to read because they add storage and delayed consumption.
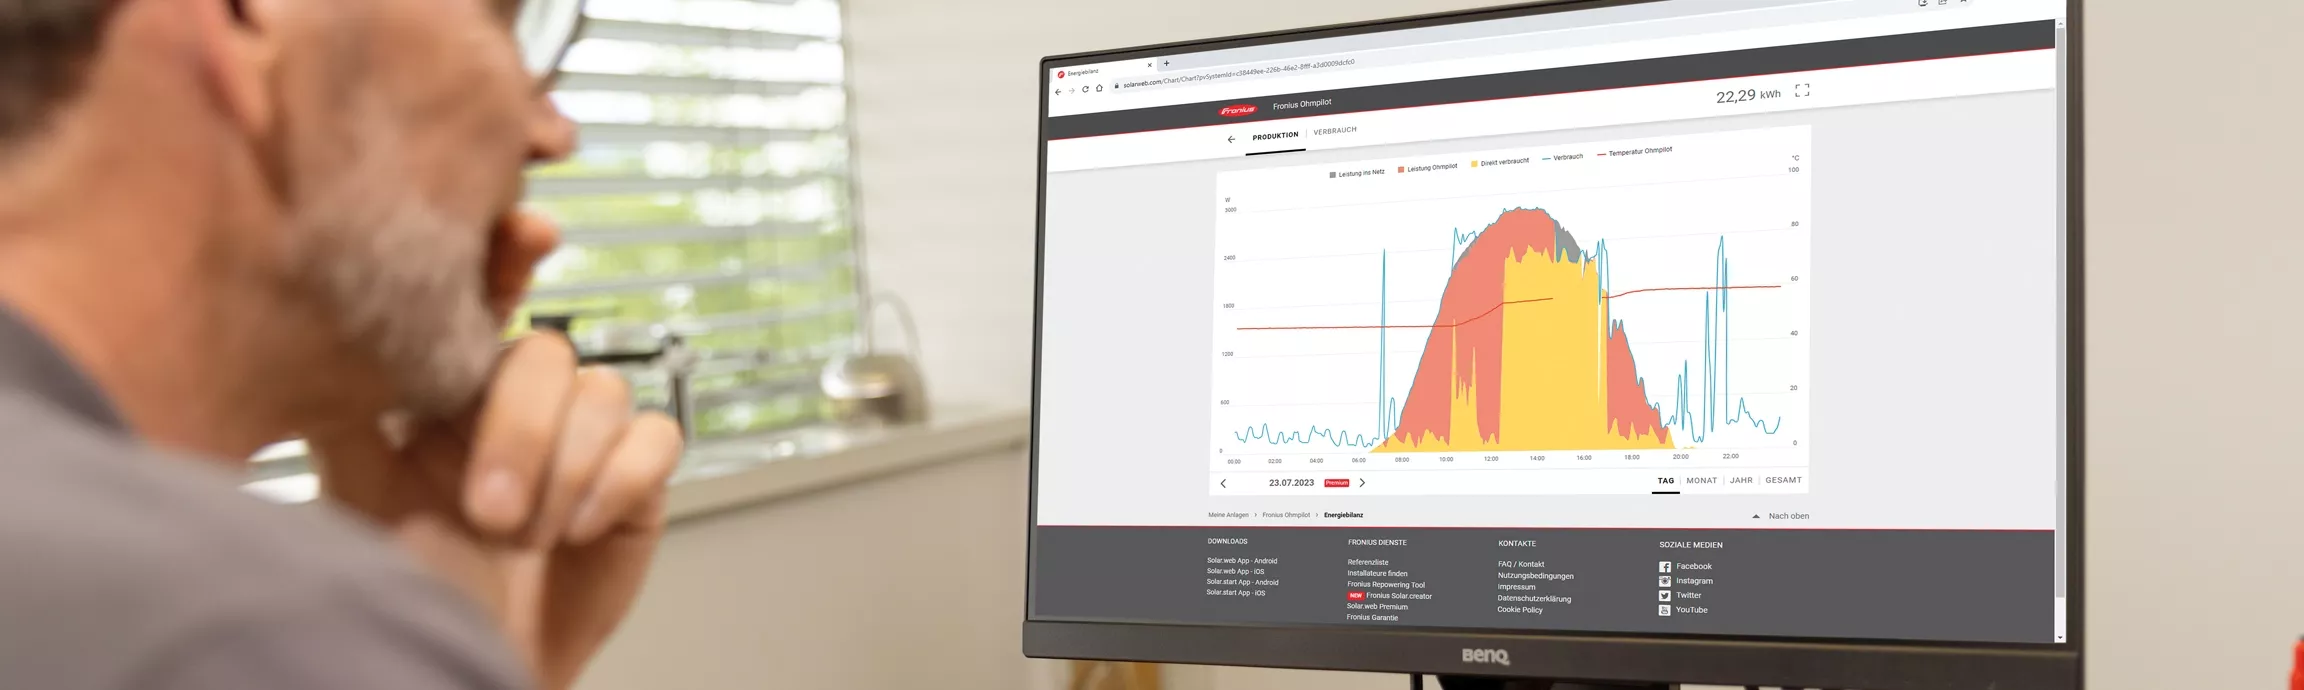
A battery is not just another load. It may charge from solar, charge from the grid, discharge to the home, reserve energy for backup, or follow a tariff schedule. If the dashboard only shows battery power without separating charge and discharge energy, the owner may misread whether the battery is improving self-consumption or simply shifting grid energy.
An EV charger creates a different problem. Charging can be the largest single household load, and a single evening charge can dominate the day. If the charger supports solar-aware charging or dynamic load management, the monitoring setup should show whether charging followed solar surplus, tariff windows, or fixed current limits.
For solar-first homes that may add an EV later, the monitoring design should leave room for charger data. That does not always mean installing a charger meter today, but it does mean choosing a data path that can grow.
Tariff and Cost Data Should Be Explicit
Energy monitoring is more useful when it connects kWh to cost. Two homes with the same self-consumption rate can have different financial outcomes if one has a high evening import tariff and the other has a flat tariff.
A good dashboard should separate:
- imported energy cost
- exported energy credit
- solar used directly in the home
- battery charge source where possible
- high-cost time windows
- low-cost or solar-rich windows for flexible loads
This is especially important in time-of-use markets. The cheapest action may not be "use less electricity" in general. It may be "move the right load from 7 p.m. to 1 p.m." or "avoid charging the battery from the grid before a sunny day."
Local Data Access Is a Design Choice
Some homes only need a vendor cloud app. Others need local data because they want automations, resilience, privacy, or integration across multiple brands.
A strong monitoring setup should be clear about data access before installation. Can the meter provide local readings? Does it support Modbus TCP, Modbus RTU, MQTT, HTTP, or a documented local API? Does it integrate with Home Assistant? Does the system still show useful data if the internet is down?
IAMMETER's solar monitoring material emphasizes measuring both grid side and inverter side to reveal generation, import, export, and self-consumption. Its open platform documentation also describes monitoring the full energy flow of a solar PV site, including generated energy, exported energy, grid consumption, and direct self-use. That kind of data structure is useful because it maps to the actual questions a solar owner is trying to answer.
Local access is not mandatory for every household, but it is much easier to design in at the beginning than to retrofit after several closed apps are already in place.
Common Signs Your Monitoring Setup Is Incomplete
Your monitoring setup probably needs attention if any of these are true:
- the inverter app shows production but not grid import or export
- the utility bill still surprises you every month
- midday import appears even when solar production is strong and no large load is obvious
- the dashboard shows negative or impossible values
- battery charge and discharge appear to double-count consumption
- EV charging makes the whole day unreadable
- three-phase data does not match the way loads are actually connected
- the app cannot answer whether exported solar would be better used on site
Some of these are hardware gaps. Others are configuration problems: reversed CT clamps, wrong phase mapping, missing voltage reference, duplicated sensors, or a dashboard that mixes instantaneous power with cumulative energy incorrectly.
A Practical Buying Checklist
Before adding equipment, ask these questions:
| Question | Why it matters |
|---|---|
| Do I need visibility only, or control as well? | Export limiting, battery control, and load management may require supported meters |
| Is the home single-phase, split-phase, or three-phase? | Phase structure affects meter choice and dashboard interpretation |
| Where is the grid import/export point? | This is usually the most important measurement boundary |
| Can the inverter already provide production data? | Avoid duplicating data unless independent verification is useful |
| Will I add a battery or EV charger later? | Choose a data path that can grow |
| Do I need local data access? | This affects meter, gateway, and platform choice |
| Who will maintain the system? | Installer-managed systems and DIY dashboards need different levels of documentation |
If you cannot answer the grid boundary and data access questions, pause before buying more hardware. Those two choices shape almost everything else.
What a Good Setup Looks Like in Practice
For a simple solar home, a good setup may be:
- inverter production data from the solar platform
- a bidirectional grid meter for import and export
- a dashboard that calculates household load and self-consumption
- tariff settings for import cost and export credit
- optional Home Assistant integration for local dashboards or automations
For a more advanced home, it may add:
- battery charge and discharge data
- EV charger power and energy
- hot water or heat pump sub-metering
- phase-level readings for three-phase supply
- local API, MQTT, or Modbus data collection
- alerts for abnormal import, export, or production patterns
The best system is the one that tells the owner what to do next. If the data cannot support a decision, it is probably decorative.
Final Recommendation
A good solar home monitoring setup should include more than an inverter production graph. It should show the full energy flow: solar generation, grid import, grid export, home consumption, self-consumption, and the behavior of large flexible loads.
Start with the main measurement boundaries, then add detail only where it changes decisions. For most homes, the first upgrade is not another shiny dashboard. It is reliable import/export monitoring and a clean data path that can grow with batteries, EV charging, tariff automation, and local energy management.
Once the monitoring setup can explain the bill, the next upgrade decision becomes much easier.
Sources
- Home Assistant Energy Management documentation
- Home Assistant Energy Cards documentation
- Fronius Smart Meter official product page
- IAMMETER Home Solar Monitoring solution
- IAMMETER Open Platform introduction
- Enphase Consumption Monitoring CT product page
- EnergyMeterHub: Why Some Solar Homes Still Feel Blind Even After Installing Extra Monitoring
- EnergyMeterHub: When a Wi-Fi Energy Meter Makes More Sense Than a Traditional DIN-Rail Meter