Grafana + InfluxDB for Energy Dashboards
Grafana and InfluxDB are often used together when a household or small site wants a custom energy dashboard instead of only using a vendor app. InfluxDB stores time-series readings, while Grafana turns those readings into charts, panels, alerts, and wallboard-style views.
Best fit
This stack is strongest when you want:
- long-term history from meters, inverters, batteries, EV chargers, or gateways,
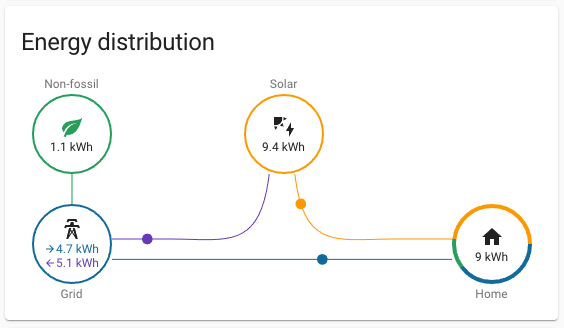
- custom panels for power, energy, voltage, current, import, export, and solar generation,
- alerts when a meter stops reporting or a value moves outside a normal range,
- and control over the database and dashboard layout.
Typical data path
A practical home setup usually looks like this:
- meter, inverter, or gateway collects the raw readings,
- MQTT, HTTP, Telegraf, Node-RED, or Home Assistant forwards the readings,
- InfluxDB stores the time-series data,
- Grafana visualises the data and handles dashboard sharing.
This is more work than a vendor app, but it is much more flexible once running.
Watchouts
Grafana and InfluxDB are not plug-and-play solar products. They are platform components. You still need a reliable collector, clean field names, correct units, and a retention strategy.
For ordinary homeowners, this stack is best when someone in the household is comfortable maintaining a small server or Raspberry Pi.